All projects 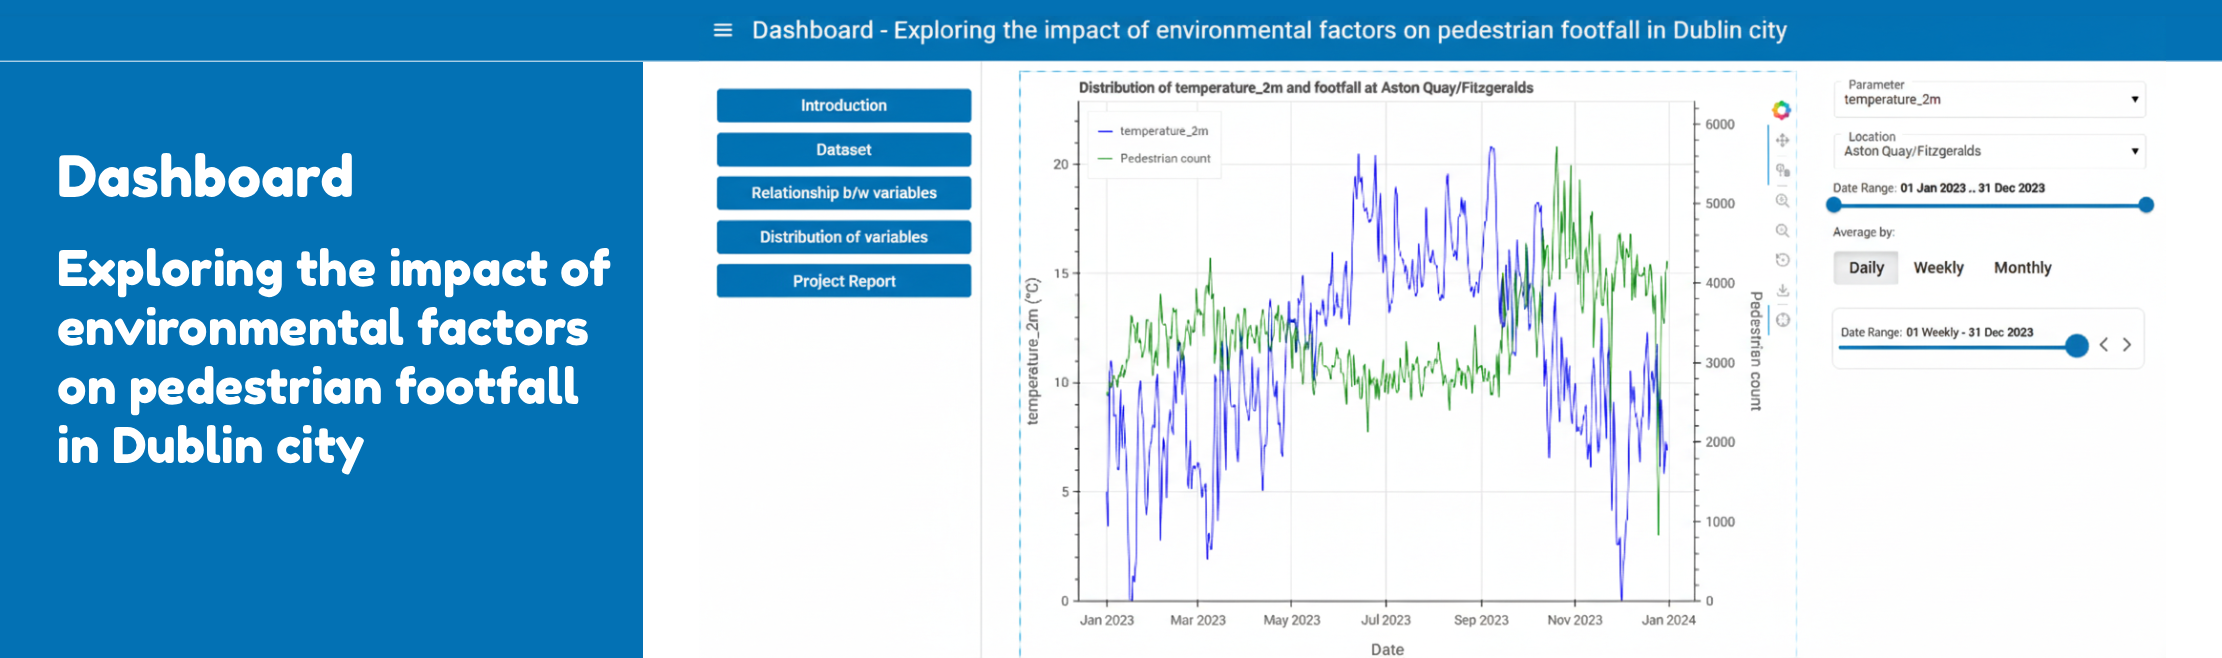
Environmental Impact on Dublin Pedestrian Footfall
Skills
Data Analytics Python Dashboard Environmental Data Visualization Team Project
About This Project
Interactive dashboard exploring the relationship between environmental factors (weather, air quality) and pedestrian footfall across 20+ Dublin city locations. Analyzed temperature, humidity, precipitation, AQI metrics, and pedestrian counter data.
Details
A collaborative Data Analytics Project (DAP) that investigates how environmental conditions influence pedestrian movement patterns in Dublin city. The project features an interactive dashboard built to visualize and analyze:
- Environmental variables: Temperature, relative humidity, dew point, apparent temperature, precipitation, rain, snowfall, cloud cover, wind speed, and sunshine duration
- Air Quality metrics: PM10, PM2.5, Carbon Monoxide, Nitrogen Dioxide, Sulphur Dioxide, Dust concentrations, and European Air Quality Index (AQI) calculations
- Pedestrian counter data from 20+ strategic Dublin locations including Grafton Street, O'Connell Street, College Green, and Grand Canal areas
The dashboard enables users to explore relationships between variables, analyze distribution patterns, and understand how weather and air quality impact urban pedestrian activity. Built as a team project with Alphons Zacharia James and Abhilash Janardhanan.